9 Text and Labels
Let’s continue with the subset of the data from the previous section and add text to the scatterplot.
ggplot(housing2001q1, aes(x = Land.Value, y = Structure.Cost)) +
  geom_point() +
  geom_text(aes(label = State))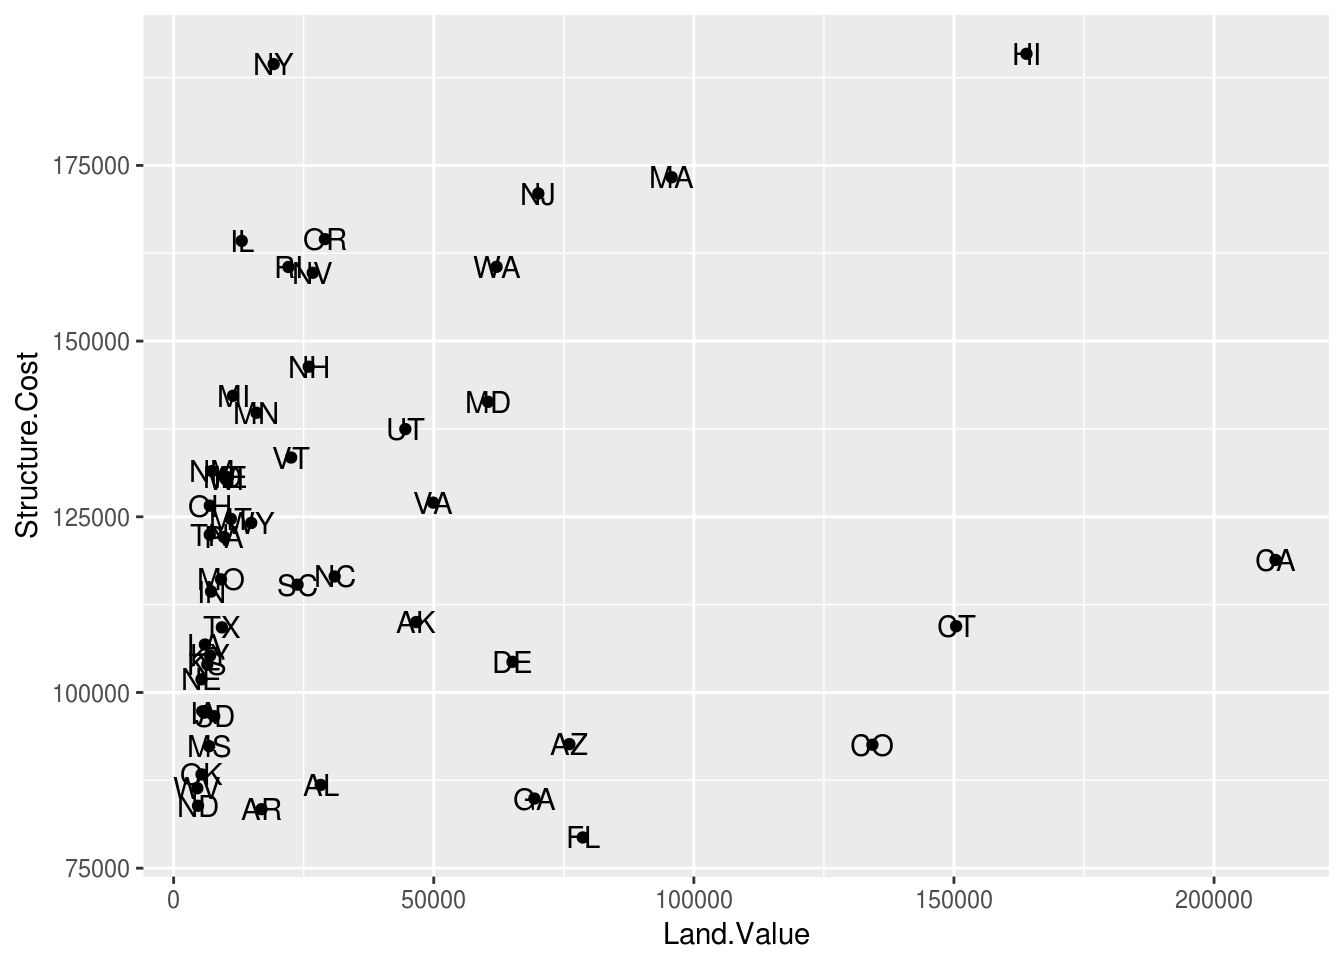
The result isn’t very nice as the labels overlap each other. Let’s try the same with geom_label() instead which draws the text with a border around it.
ggplot(housing2001q1, aes(x = Land.Value, y = Structure.Cost)) +
  geom_point() +
  geom_label(aes(label = State))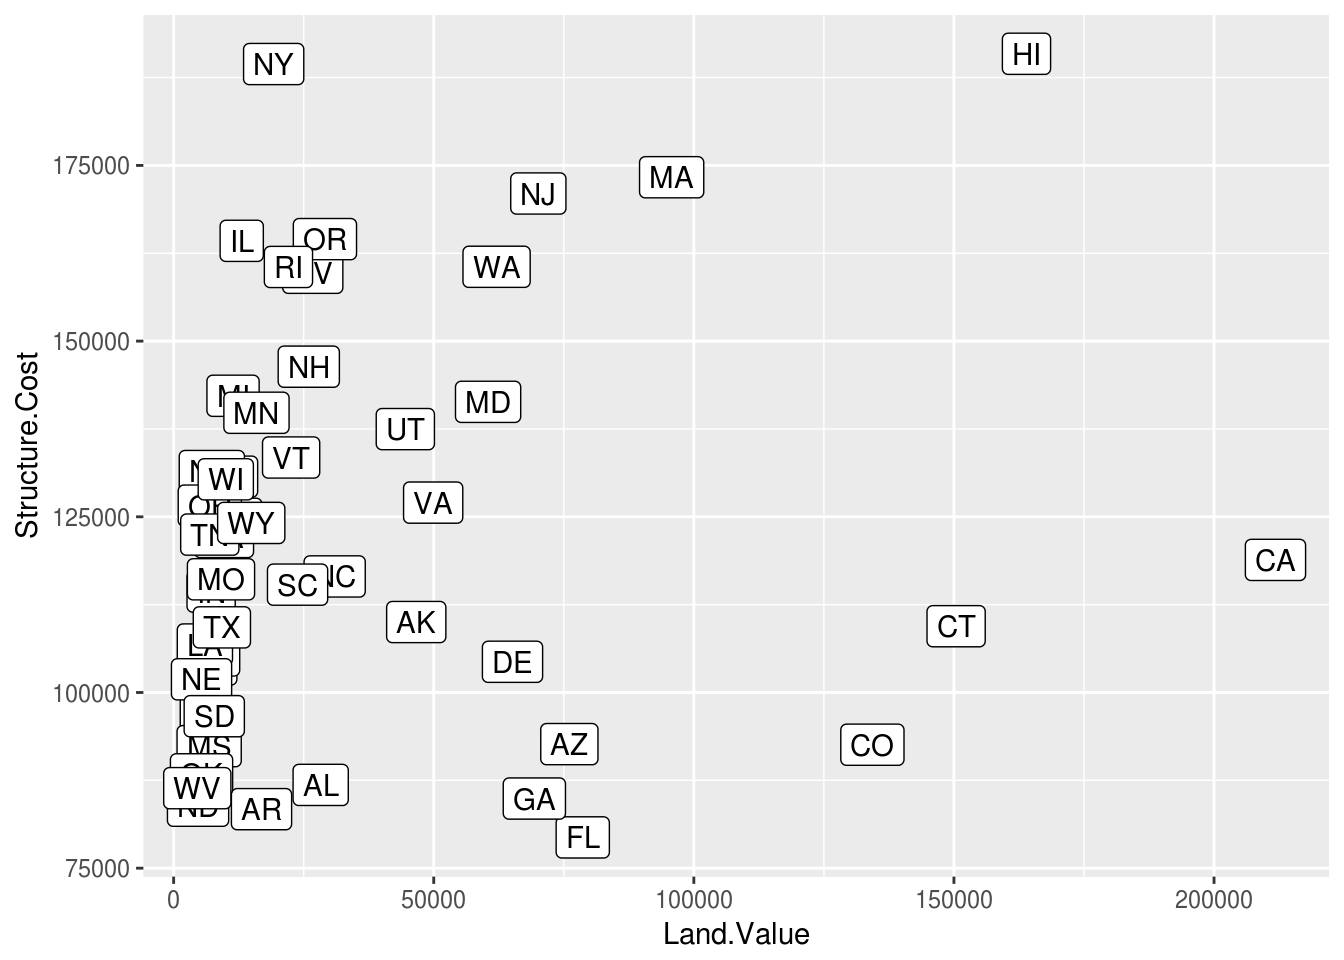
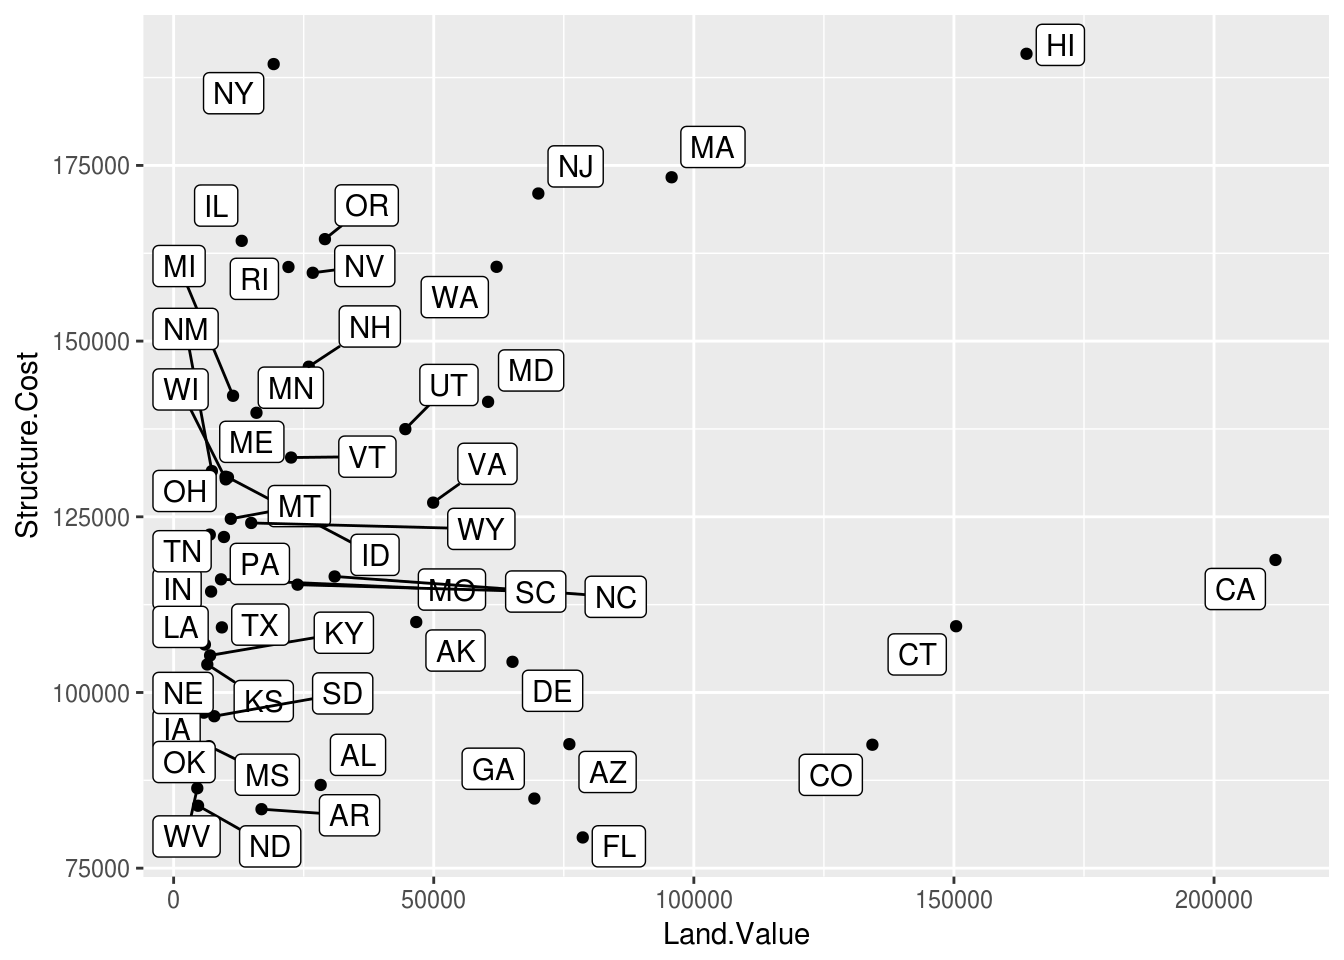
The ggrepel extension we loaded earlier can also help fix this problem.
ggplot(housing2001q1, aes(x = Land.Value, y = Structure.Cost)) +
  geom_point() +
  geom_text_repel(aes(label = State))
And we can repel the labels with a border using geom_label_repel().
ggplot(housing2001q1, aes(x = Land.Value, y = Structure.Cost)) +
  geom_point() +
  geom_label_repel(aes(label = State))