7 Geoms and Statistics
Geometric objects (geoms) define the basic shape of the elements on the plot.
- Every geom has a default statistic
- Every statistic has a default geom
You can get a list of all geoms using the online help in RStudio
help.search("geom_", package = "ggplot2")Change the size of each bin:
ggplot(housing, aes(x = Home.Value)) +
  geom_histogram(binwidth = 1000)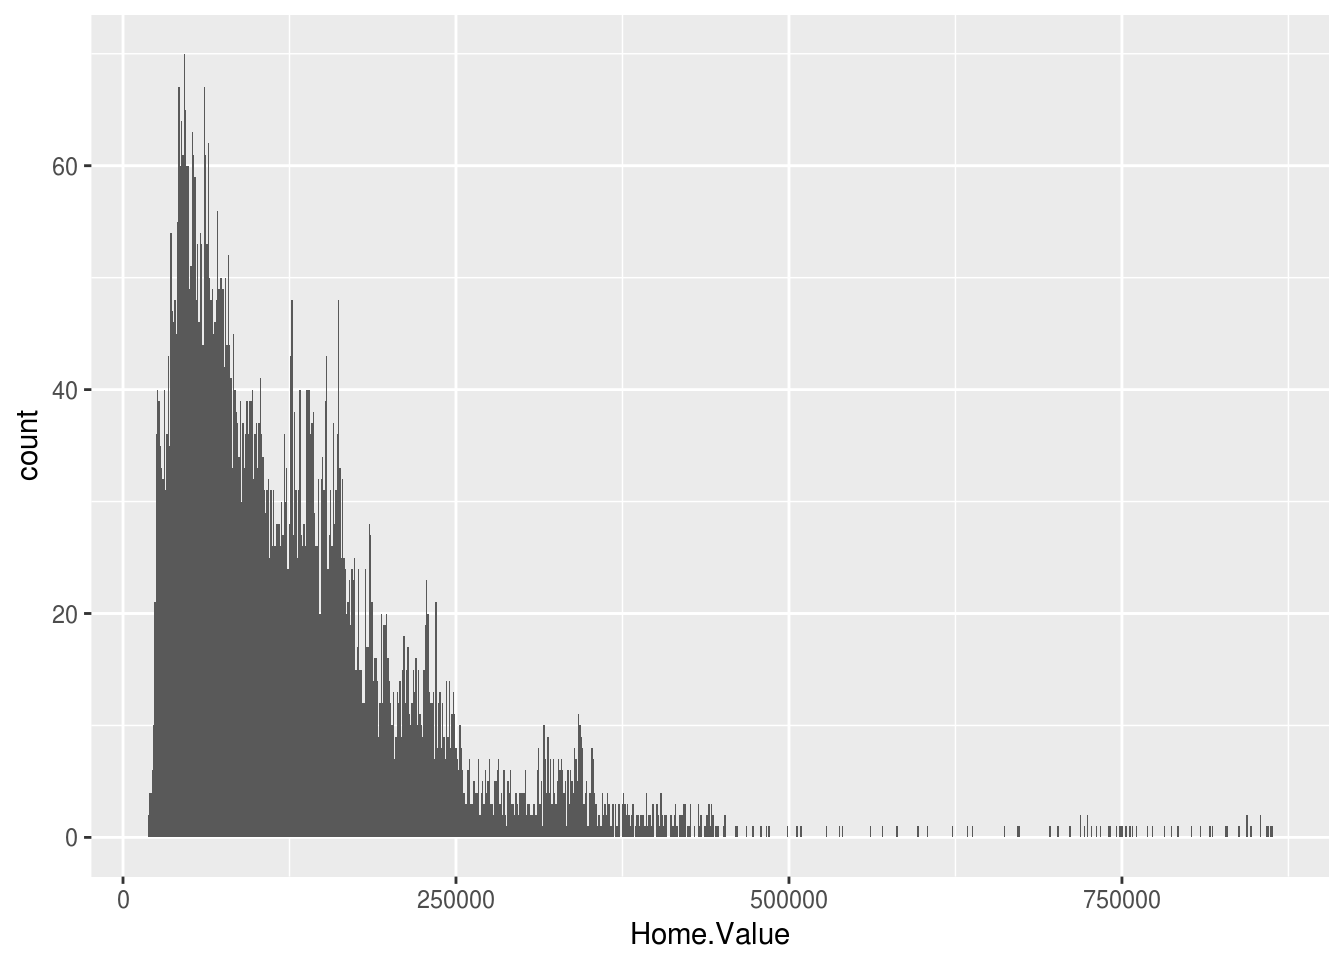
Add a mapping for the fill color:
ggplot(housing, aes(x = Home.Value, fill = Region)) +
  geom_histogram(binwidth = 1000)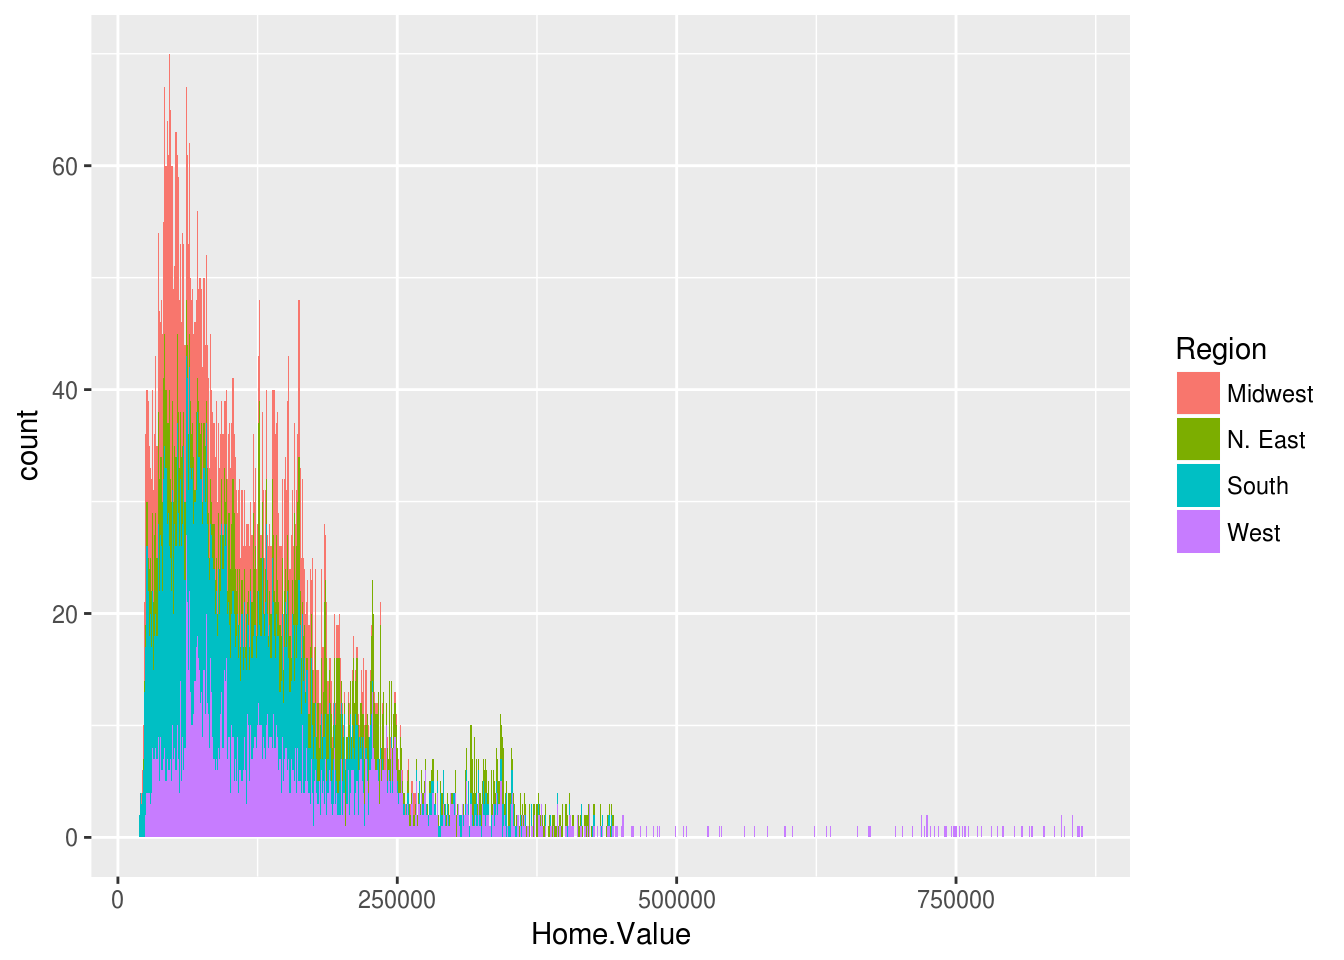
Mapping can also be specified in the geom:
ggplot(housing, aes(x = Home.Value)) +
  geom_histogram(aes(fill = Region), binwidth = 1000)
Same plot can also be created using stat_bin transformation. The default geom for stat_bin is “area”
ggplot(housing, aes(x = Home.Value)) +
  stat_bin(binwidth = 1000)
Change the default geom to "point"
ggplot(housing, aes(x = Home.Value)) +
  stat_bin(geom = "point", binwidth = 1000)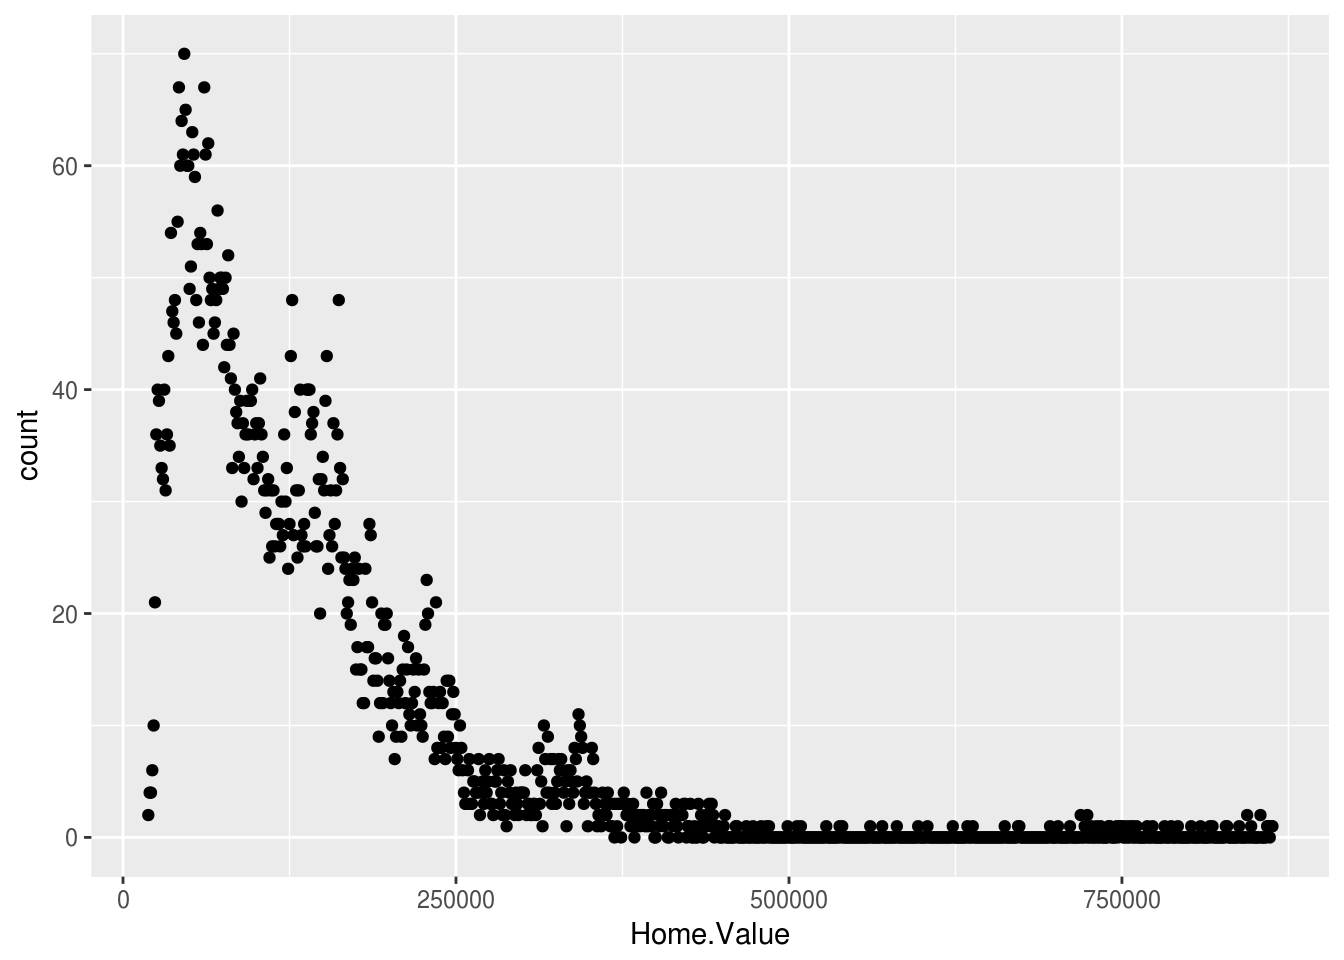
Change the default geom to "line"
ggplot(housing, aes(x = Home.Value)) +
  stat_bin(geom = "line", binwidth = 1000)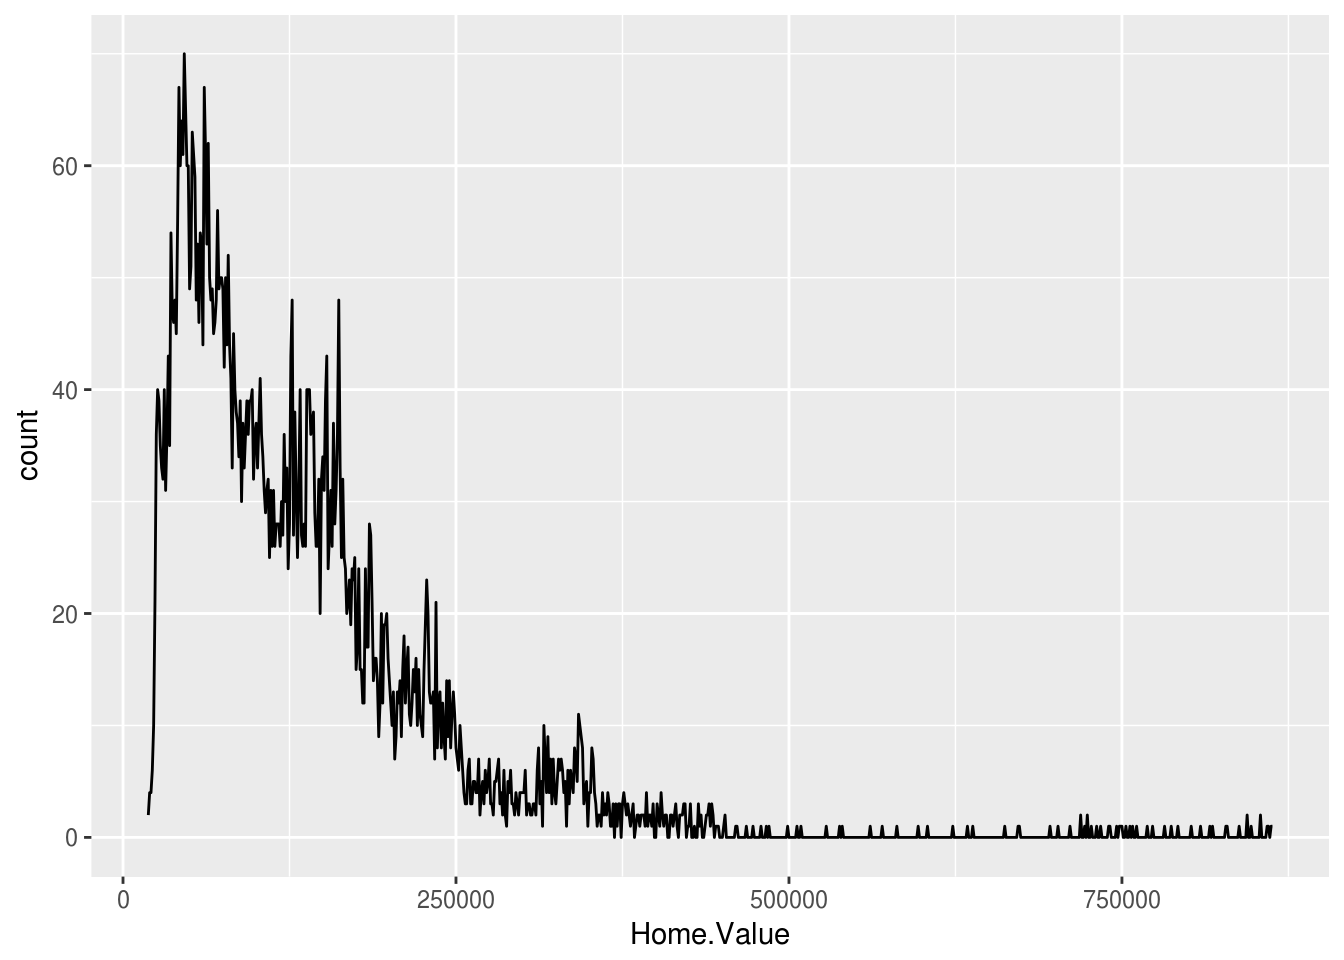
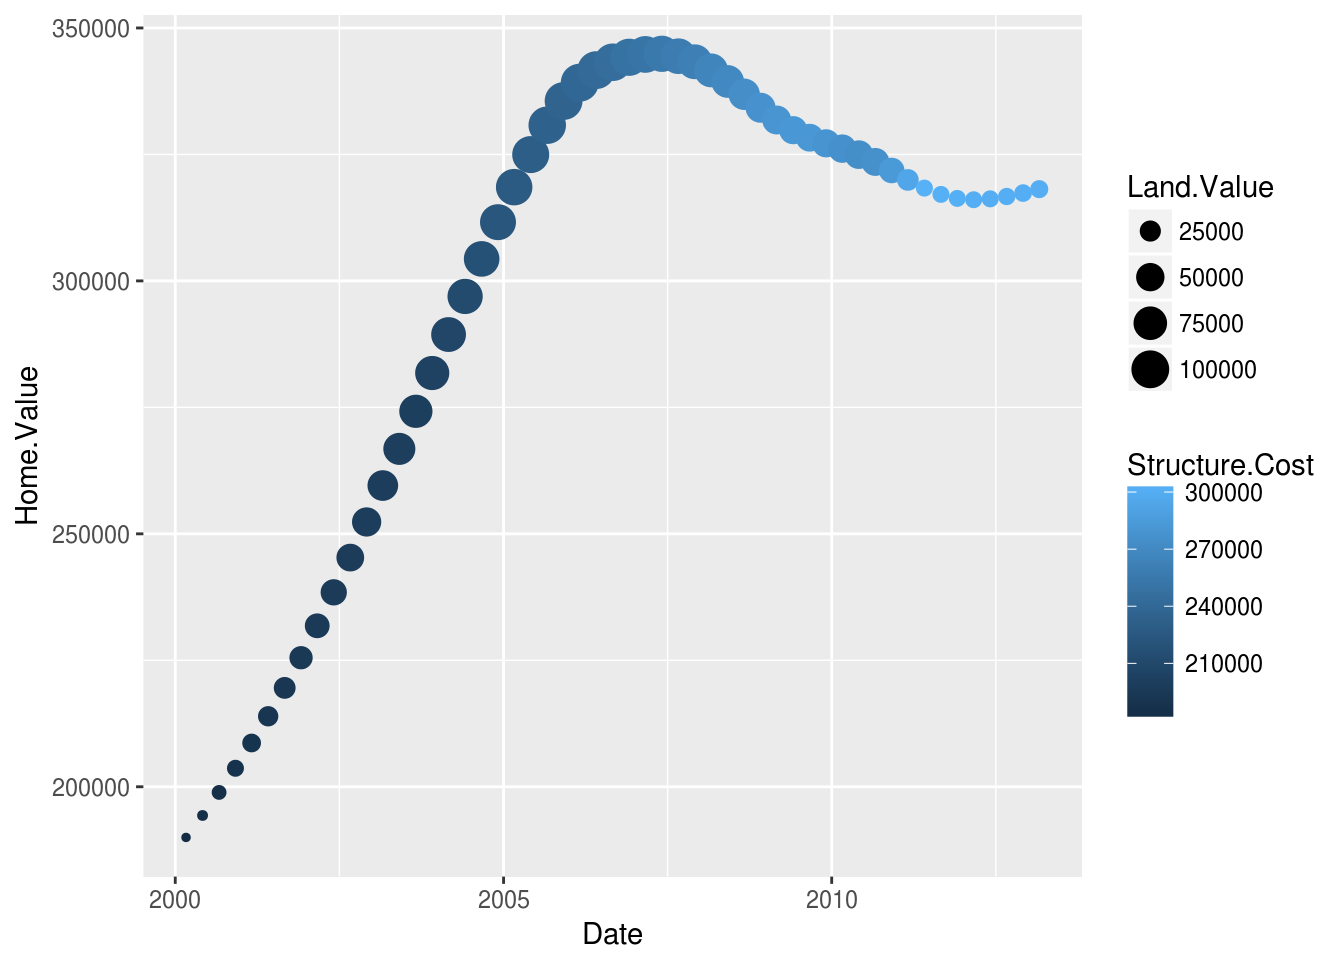
7.1 Exercise
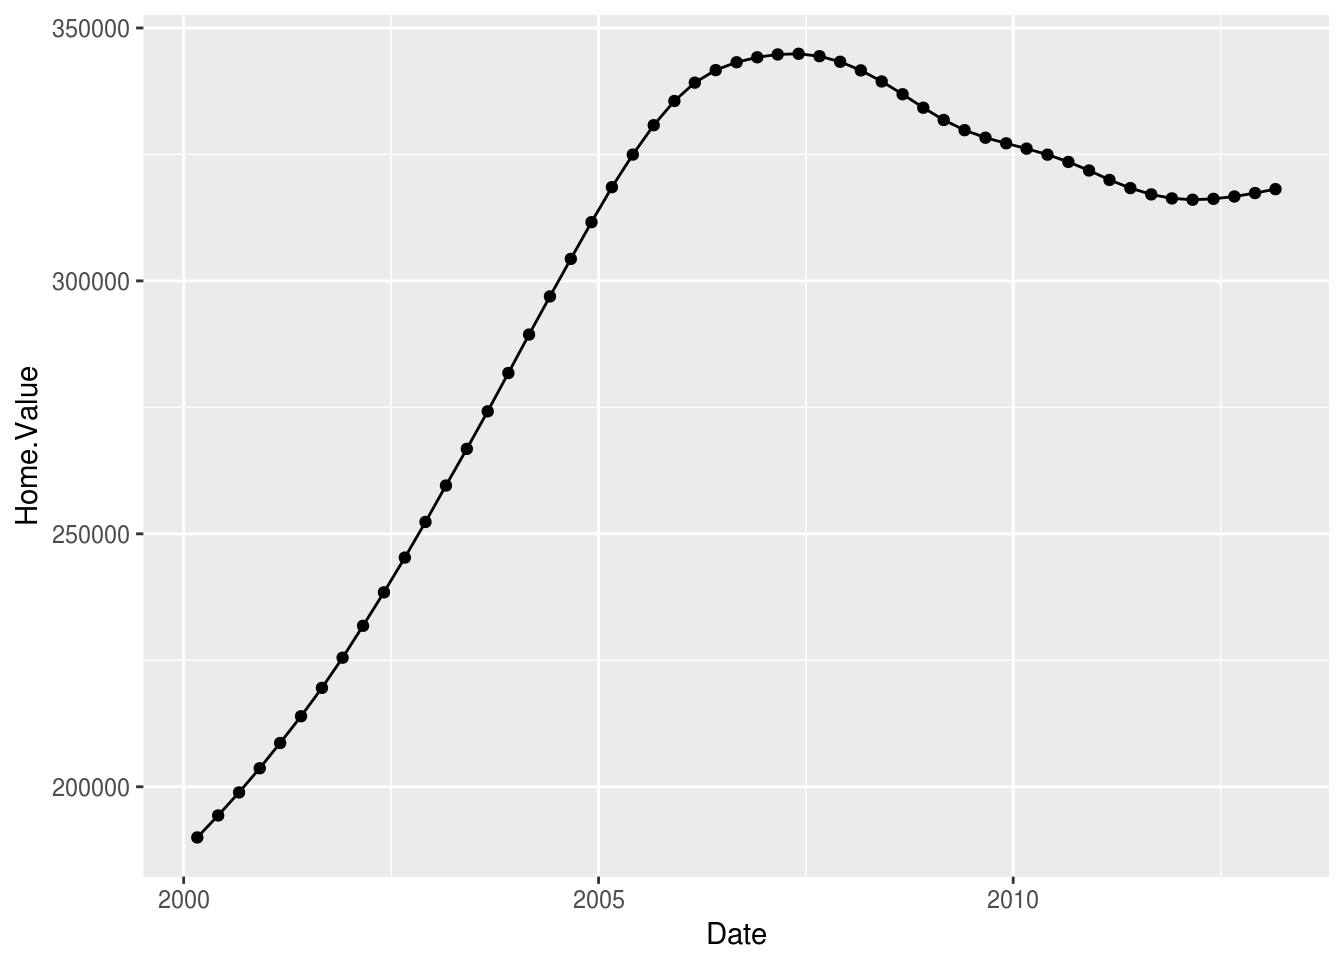
Create a subset of housing data from New York since 2000
newyork2k <- subset(newyork, Year >= 2000)Create a plot that includes multiple geometric objects, for example, lines and points.
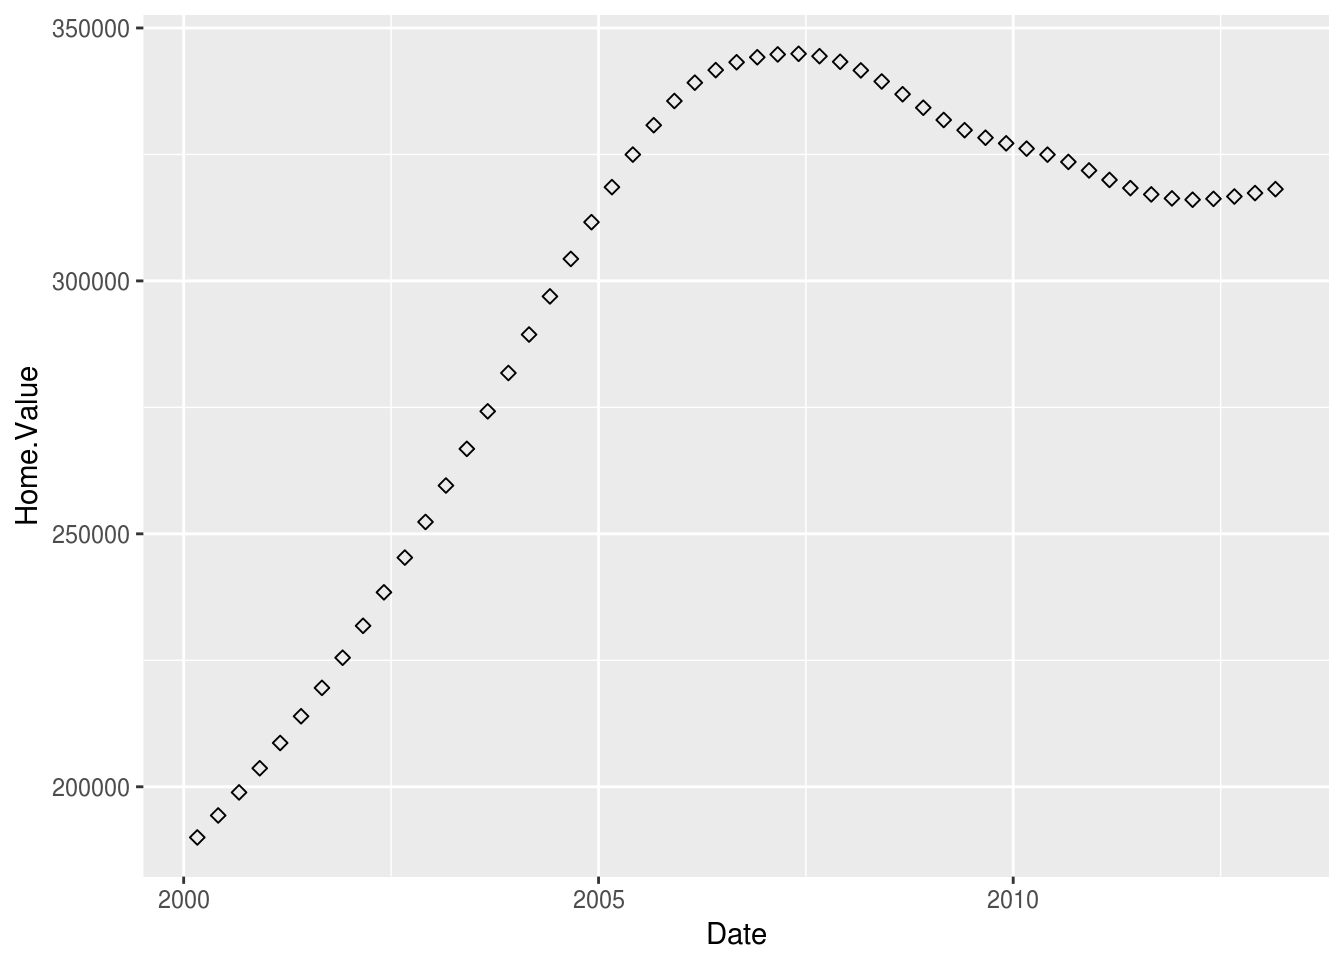
Change the shape to be hollow diamond
HINT: Take a look at Shape Scales in the Data Visualization with ggplot2 Cheat Sheet
Change the size of the point based on
Land.Valueand color based onStructure.Cost