8 Scales
Let’s create another subset that includes only the data from the first quarter of 2001.
housing2001q1 <- subset(housing, Year == 2001 & Quarter == 1)And now we create a scatter plot with this dataset
ggplot(housing2001q1, aes(x = Land.Value, y = Structure.Cost)) +
  geom_point()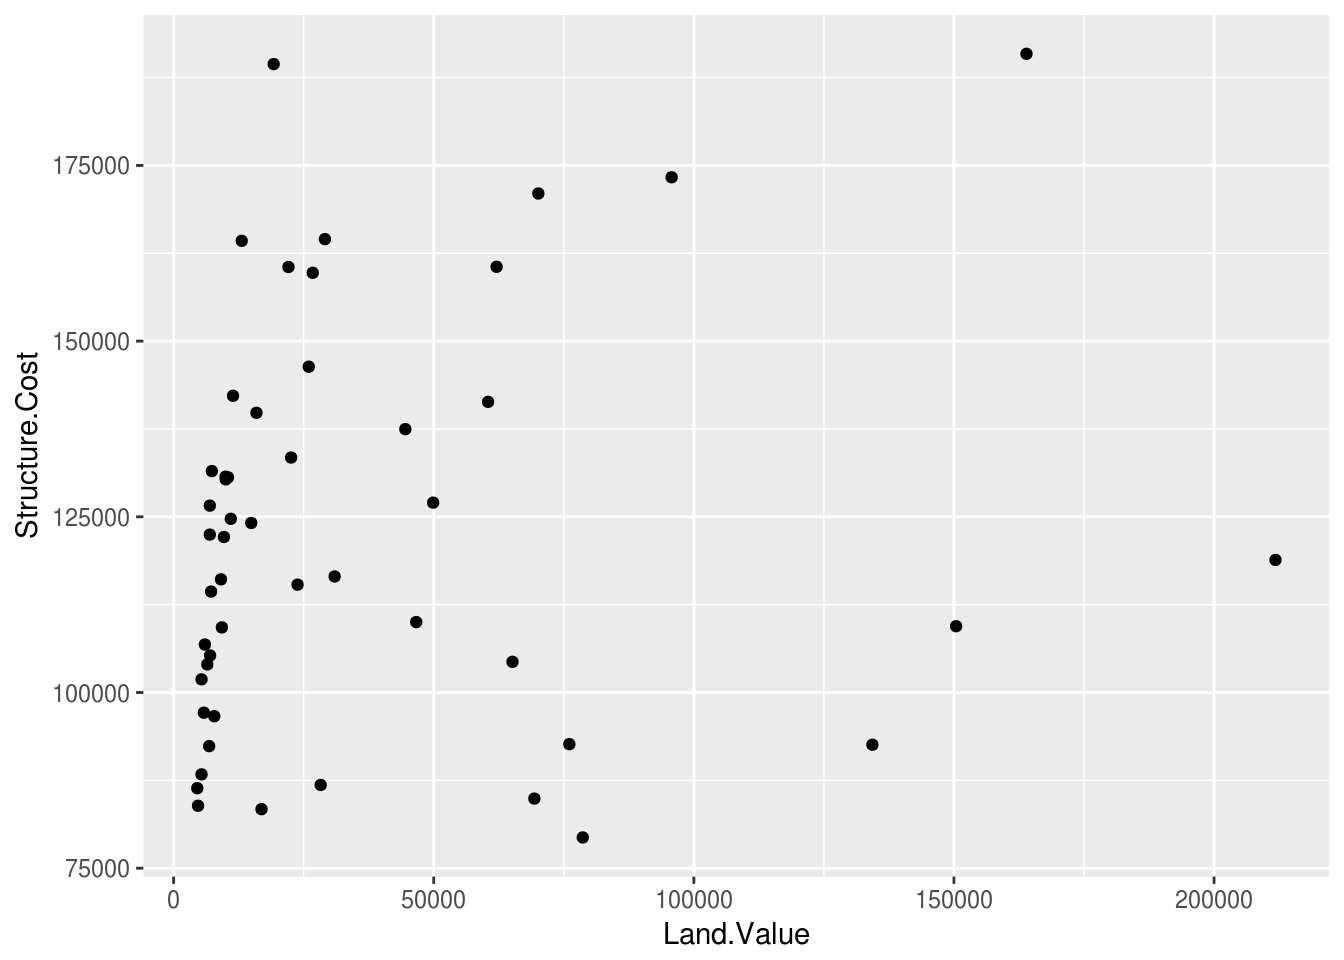
Our dataset is skewed so in order to help with interpretation, let’s change the x-axis to log scale
ggplot(housing2001q1, aes(x = Land.Value, y = Structure.Cost)) +
  geom_point() +
  scale_x_log10()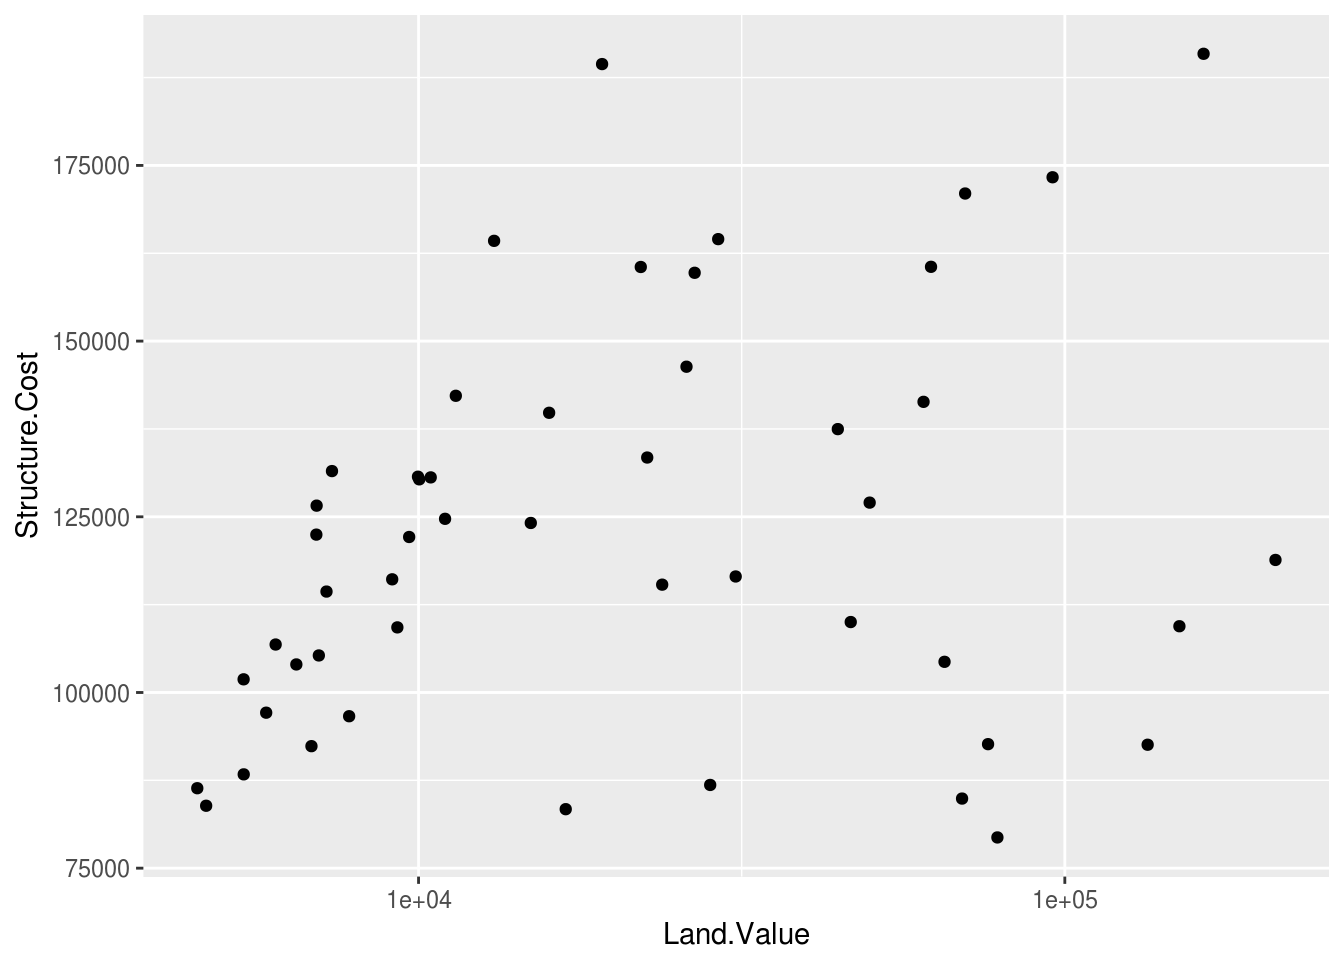
Now add a dollar sign in front of our axis labels
ggplot(housing2001q1, aes(x = Land.Value, y = Structure.Cost)) +
  geom_point() +
  scale_x_log10(labels = dollar) +
  scale_y_continuous(labels = dollar)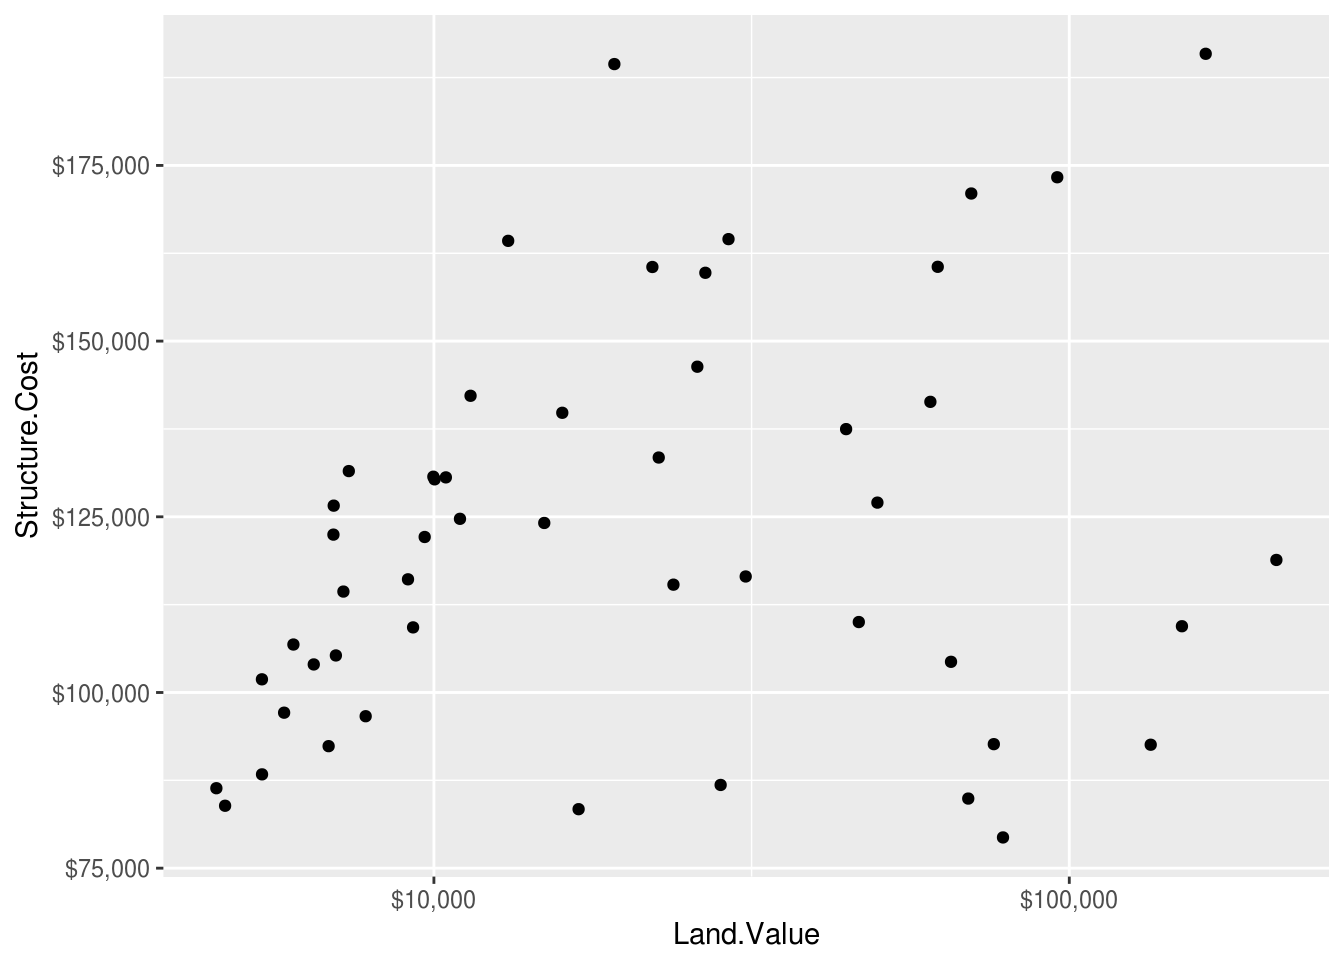
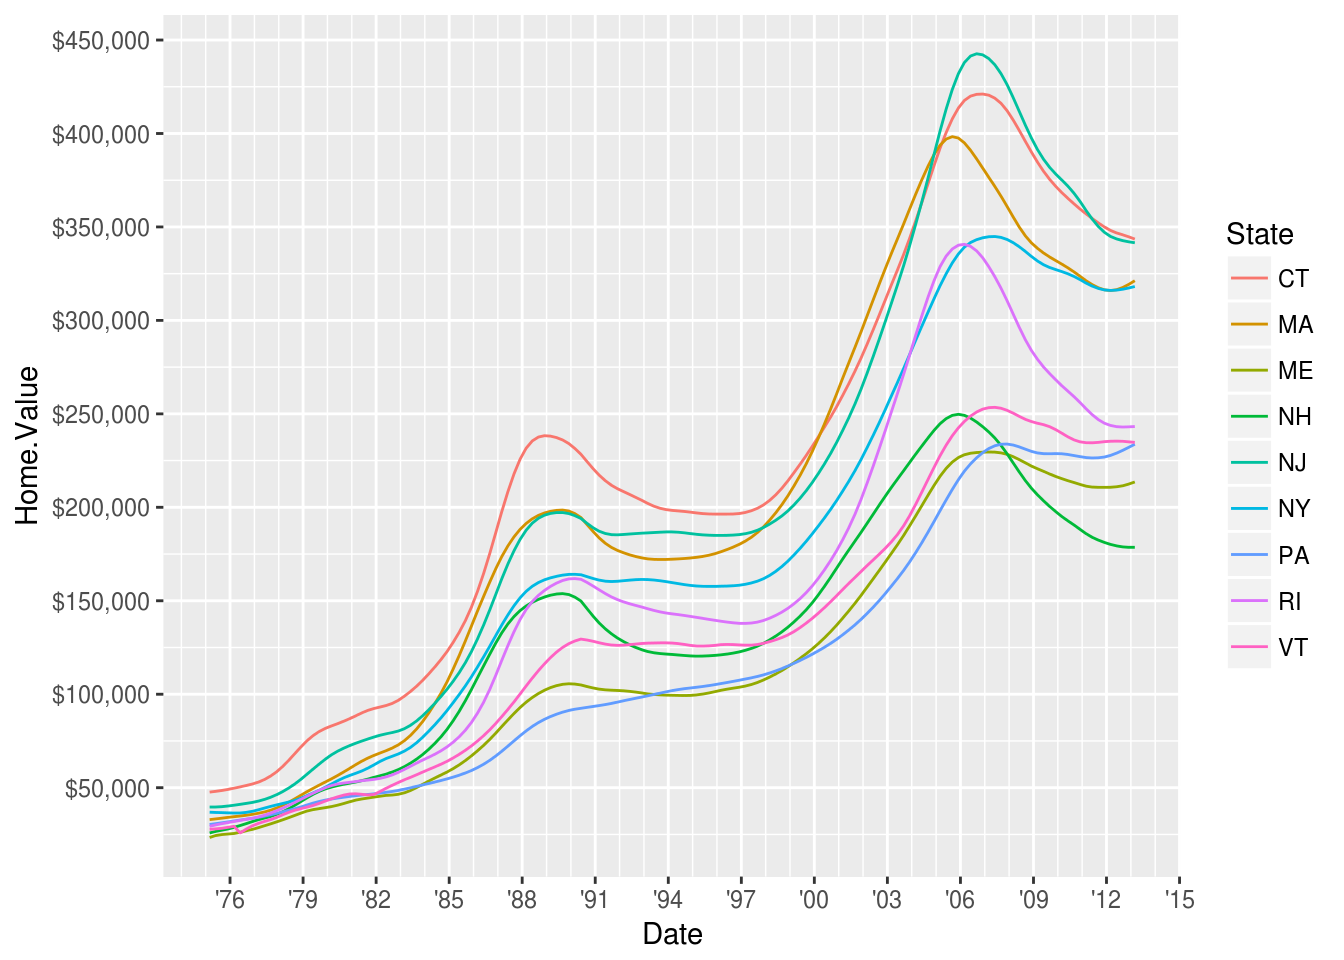
Next we change the scale for the x-axis which is in a Date format and control the breaks for y-axis which is a continuous variable.
ggplot(northeast, aes(x = Date, y = Home.Value, color = State)) +
  geom_line() +
  scale_x_date(date_breaks ="3 year", date_minor_breaks ="1 year", date_labels = "'%y") +
  scale_y_continuous(breaks = seq(0, 500000, 50000), labels = dollar)