10 Smoother
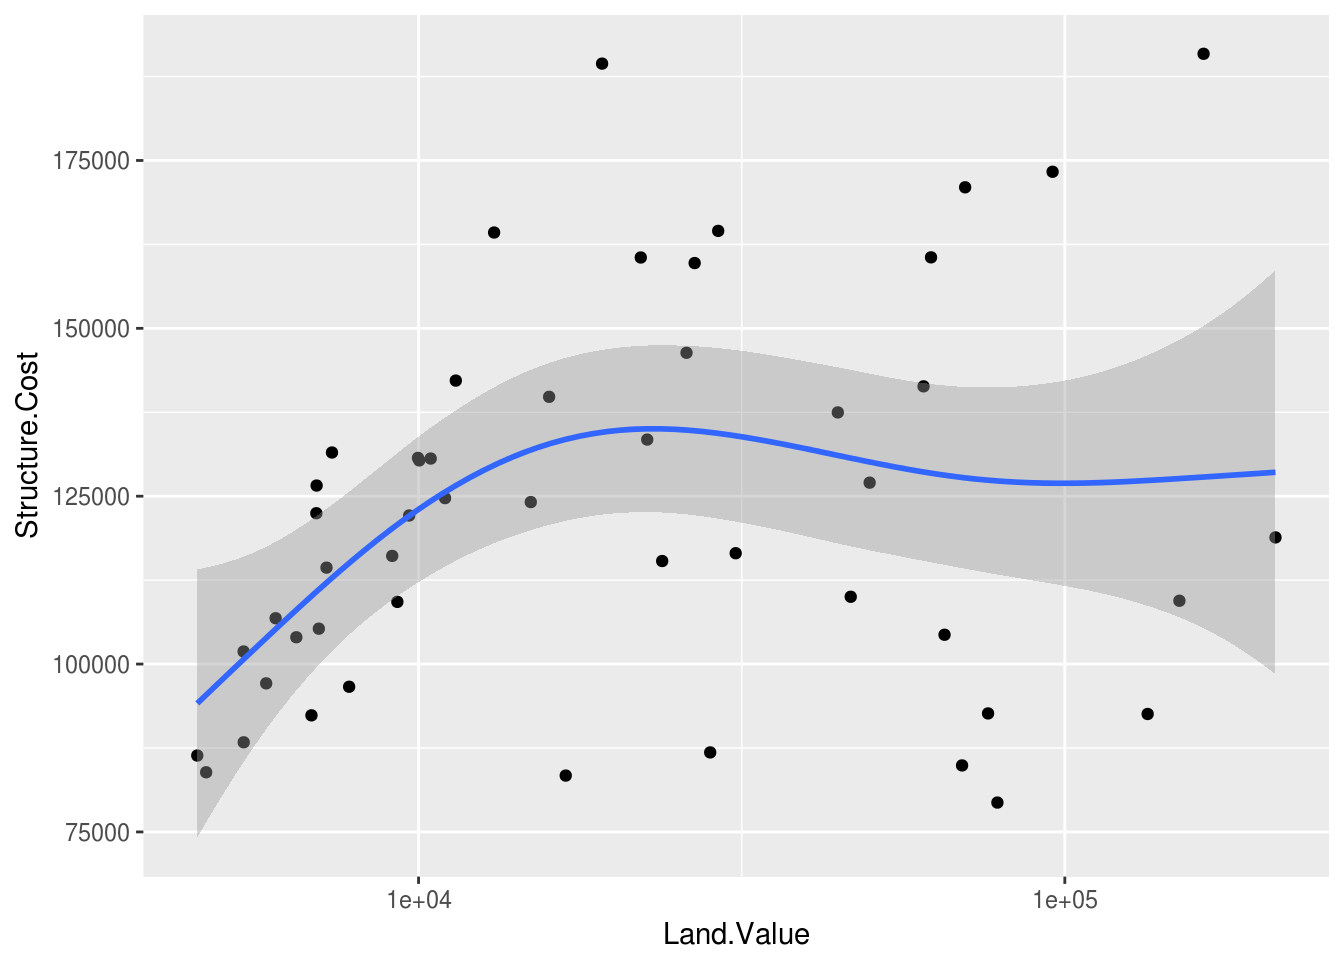
Let’s continue with the 2001 first quarter dataset and add a smoother.
ggplot(housing2001q1, aes(x = Land.Value, y = Structure.Cost)) +
  geom_point() +
  scale_x_log10() +
  stat_smooth()
## `geom_smooth()` using method = 'loess'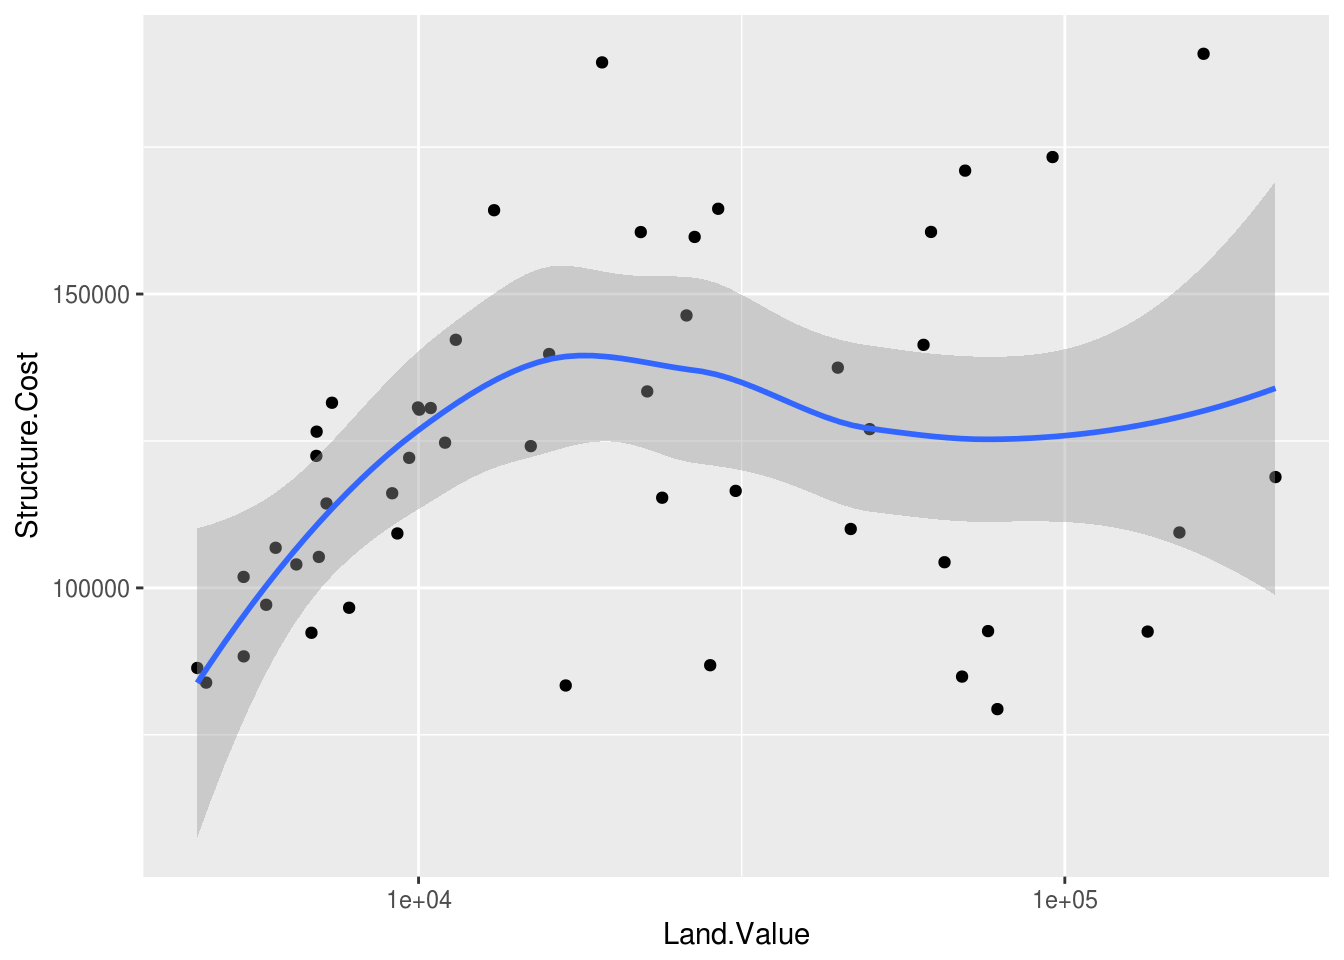
We can fit a linear model to our dataset
ggplot(housing2001q1, aes(x = Land.Value, y = Structure.Cost)) +
  geom_point() +
  scale_x_log10() +
  stat_smooth(method = "lm")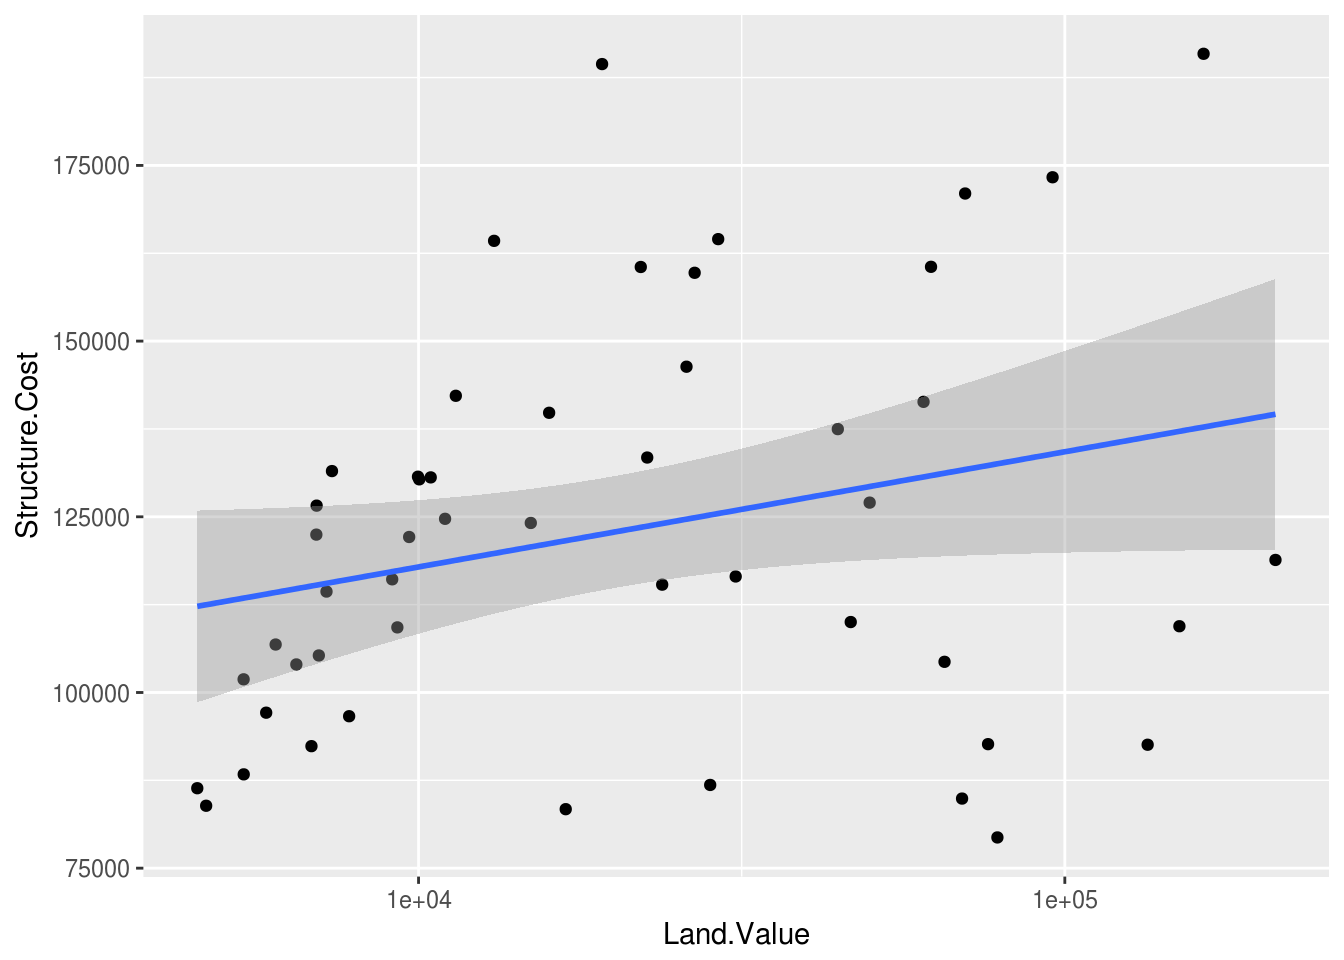
We can also specify the formula for the model
ggplot(housing2001q1, aes(x = Land.Value, y = Structure.Cost)) +
  geom_point() +
  scale_x_log10() +
  stat_smooth(method = "lm", formula = y ~ log(x))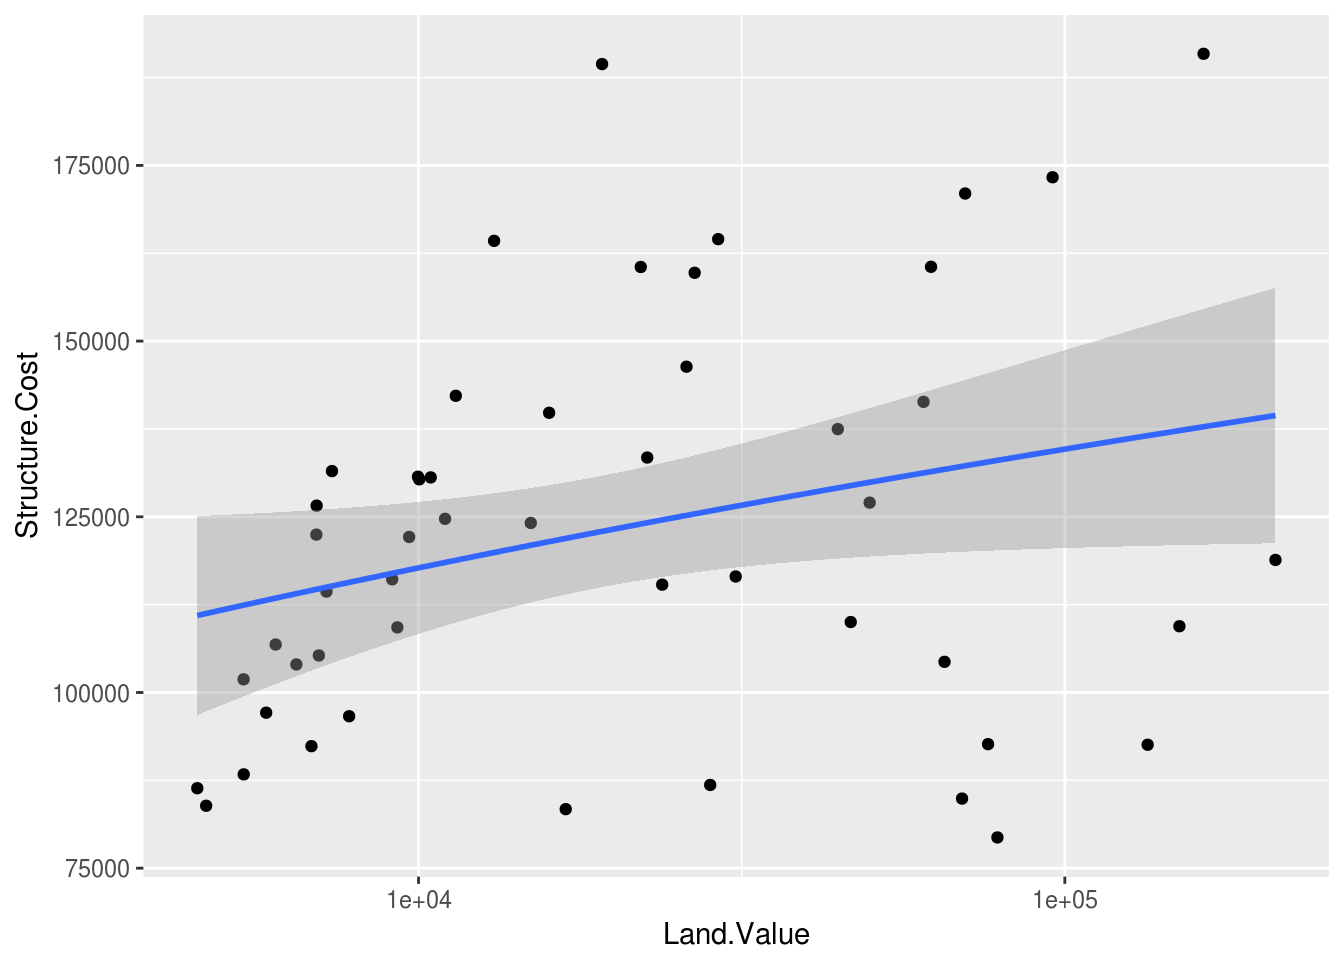
We can turn the turn off the confidence interval
ggplot(housing2001q1, aes(x = Land.Value, y = Structure.Cost)) +
  geom_point() +
  scale_x_log10() +
  stat_smooth(method = "lm", formula = y ~ log(x), se = FALSE)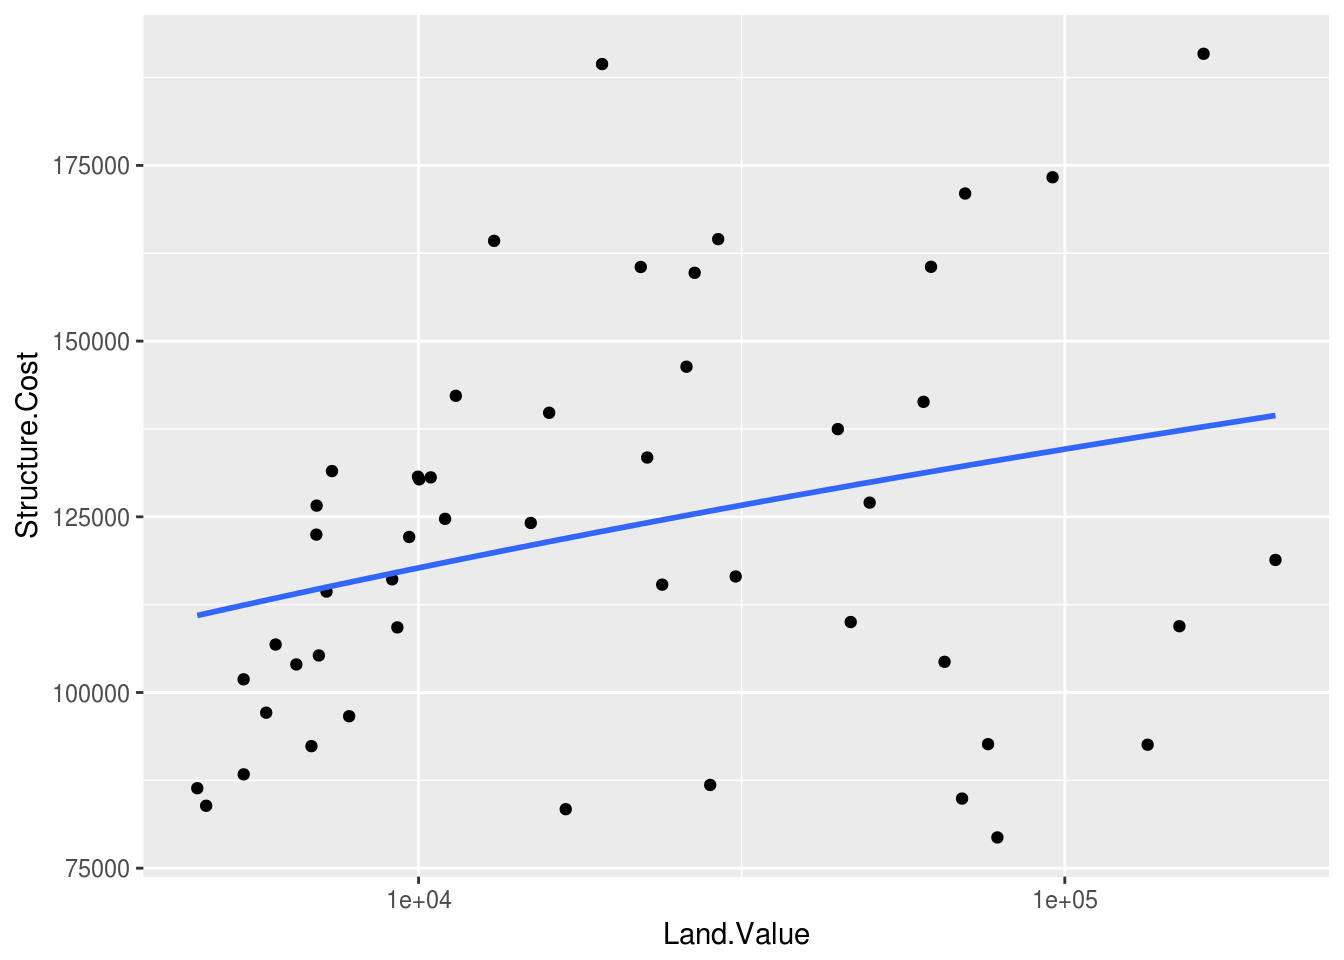
Formula is specific to the type of model used. Here we’re using a General Additive Model (GAM).
ggplot(housing2001q1, aes(x = Land.Value, y = Structure.Cost)) +
  geom_point() +
  scale_x_log10() +
  stat_smooth(method = "gam", formula = y ~ s(x,k=10))