12 Facets
Let’s plot the northeast data again
ggplot(northeast, aes(x = Date, y = Home.Value, color = State)) +
  geom_line()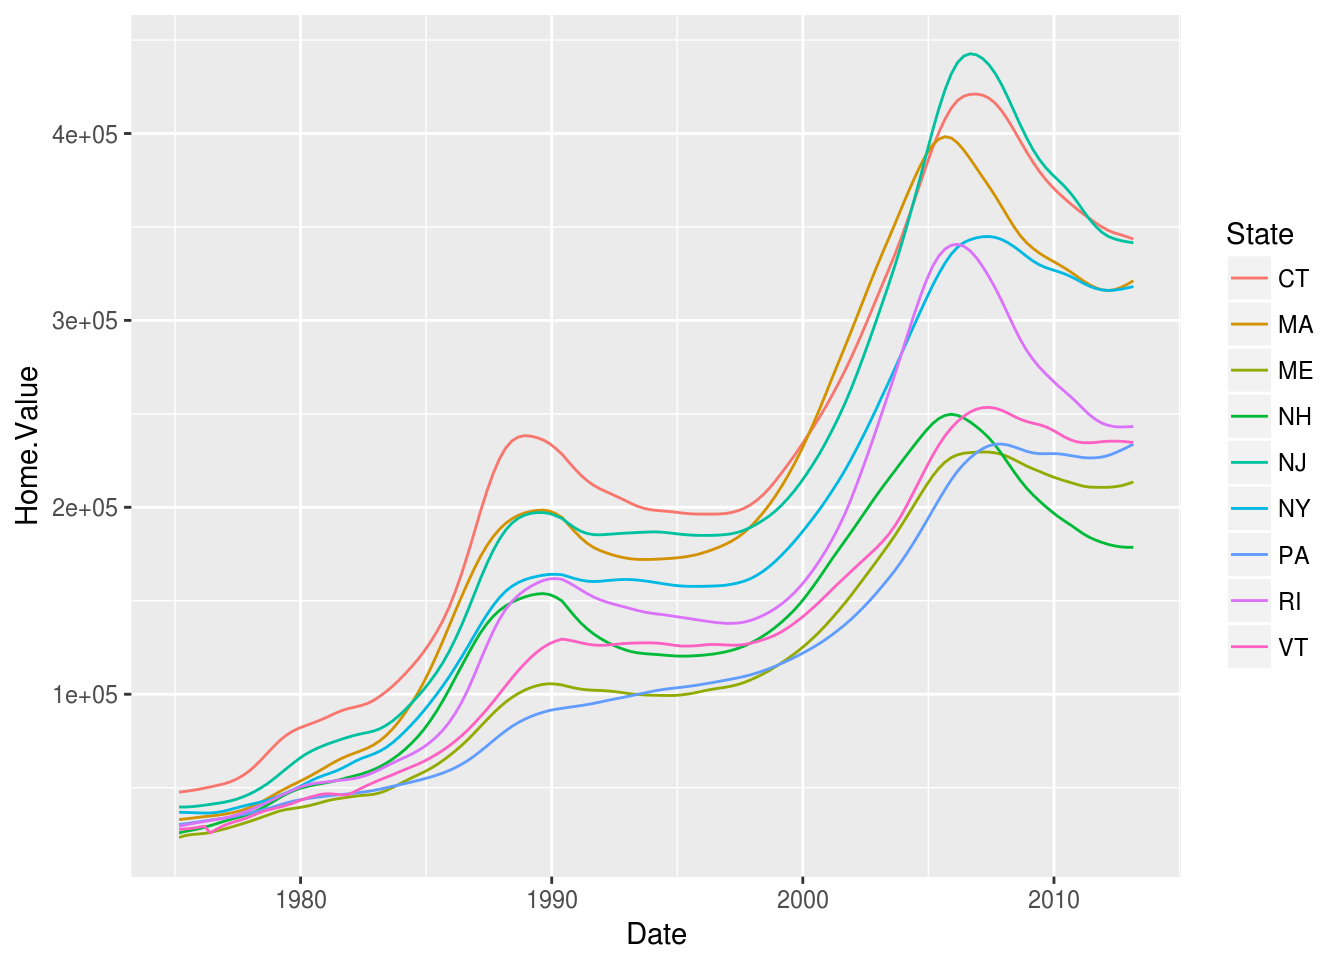
But what if we were to plot the entire dataset?
ggplot(housing, aes(x = Date, y = Home.Value, color = State)) +
  geom_line()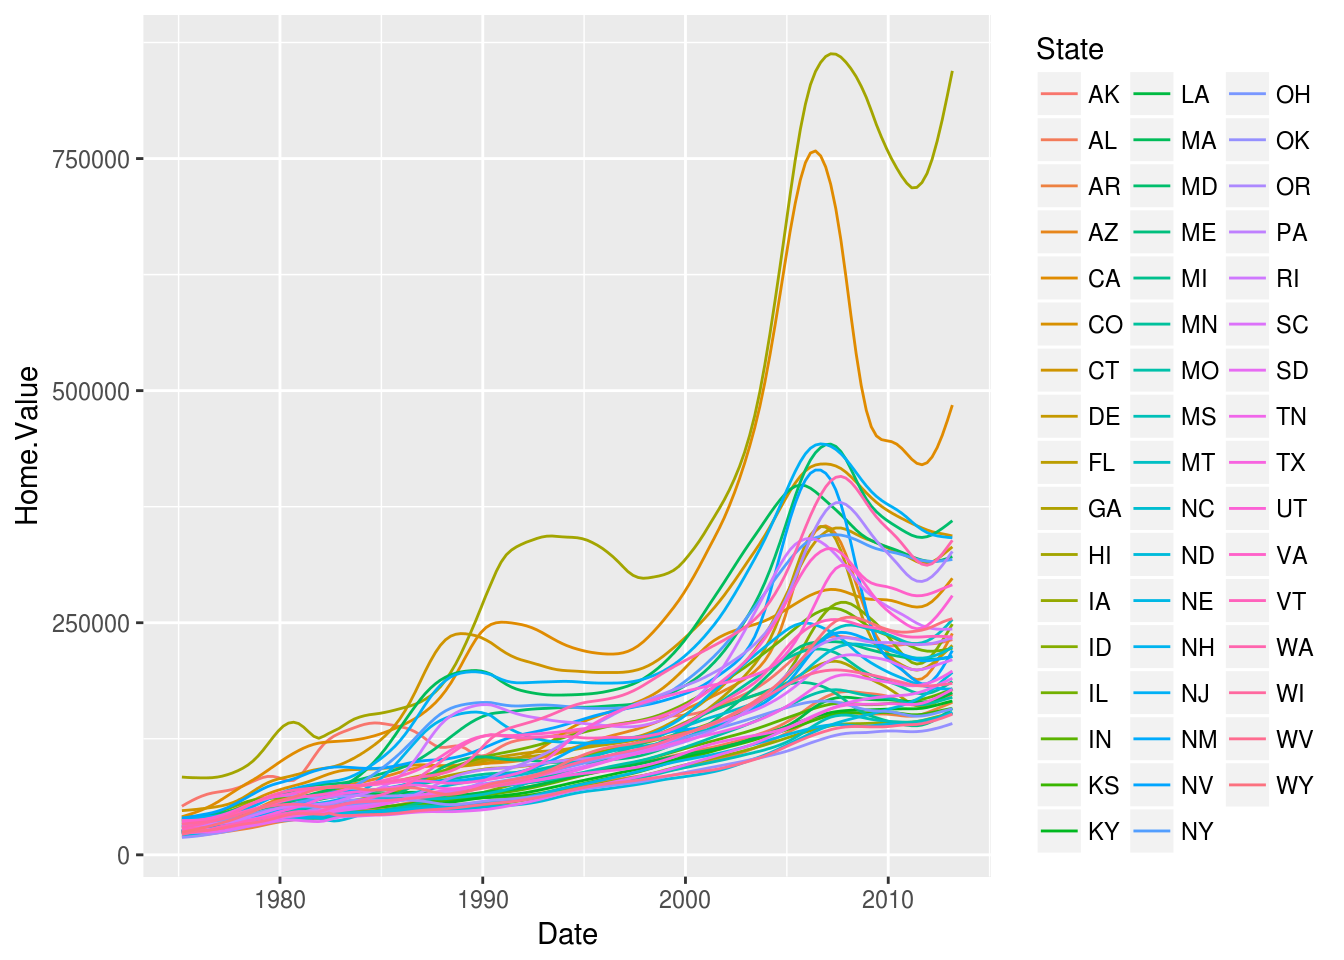
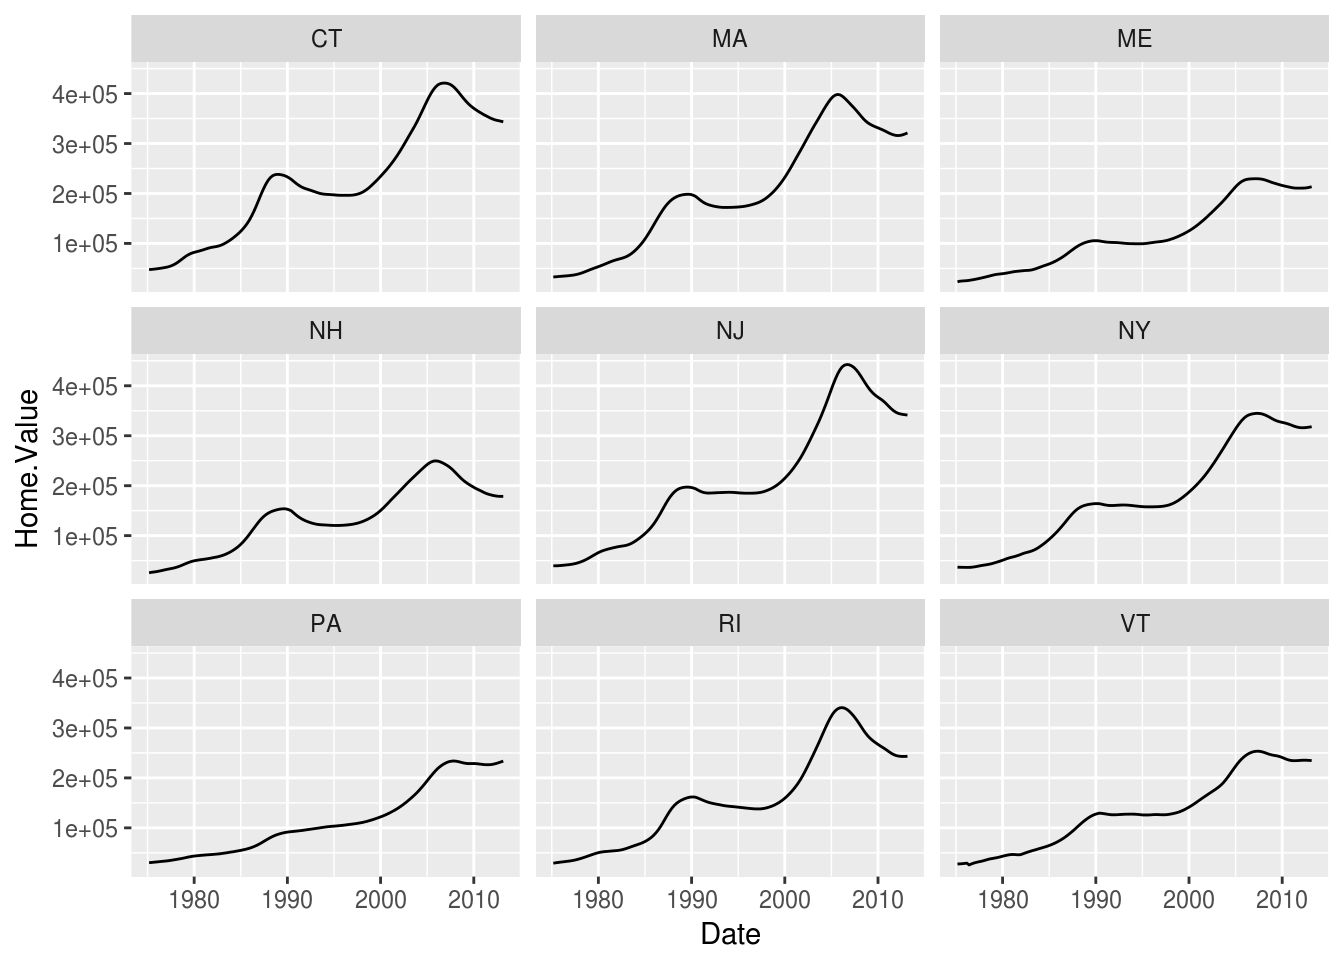
The plot is not very informative anymore. We can use facets to split the plot based on the State
ggplot(northeast, aes(x = Date, y = Home.Value)) +
  geom_line() +
  facet_wrap(~State, ncol = 3)