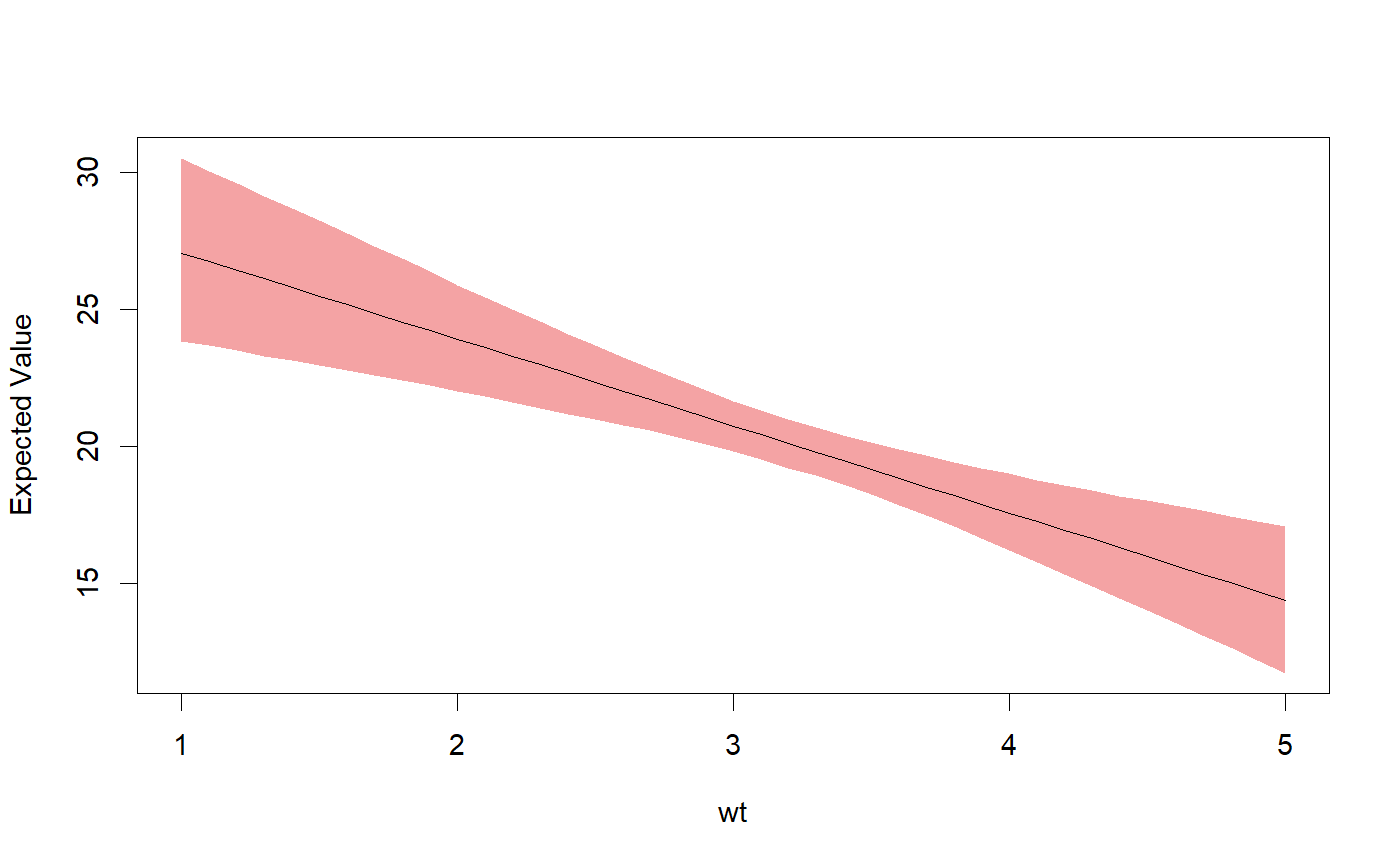
Plot Regression Simulations
plots regression simulation results
# S3 method for regsim
plot(x, formula = NULL, ...)
Arguments
| x | an object of class |
|---|---|
| formula | a formula such as ~x or ~x1 + x2 |
| ... | additional arguments passed to class-specific functions |
Examples
library(regsim)

model <- lm(mpg ~ wt + cyl, data = mtcars)
x <- list(wt = seq(1, 5, 0.1))
sim <- regsim(model, x)
plot(sim)
